-This is a share. The original post was by Performance Property. Reason for sharing is to show the level of research you should look for when investigating certain locations and property types.-
“This past month our research has focused on the Sunshine Coast, Gold Coast, Orange, Albury and Wagga Wagga
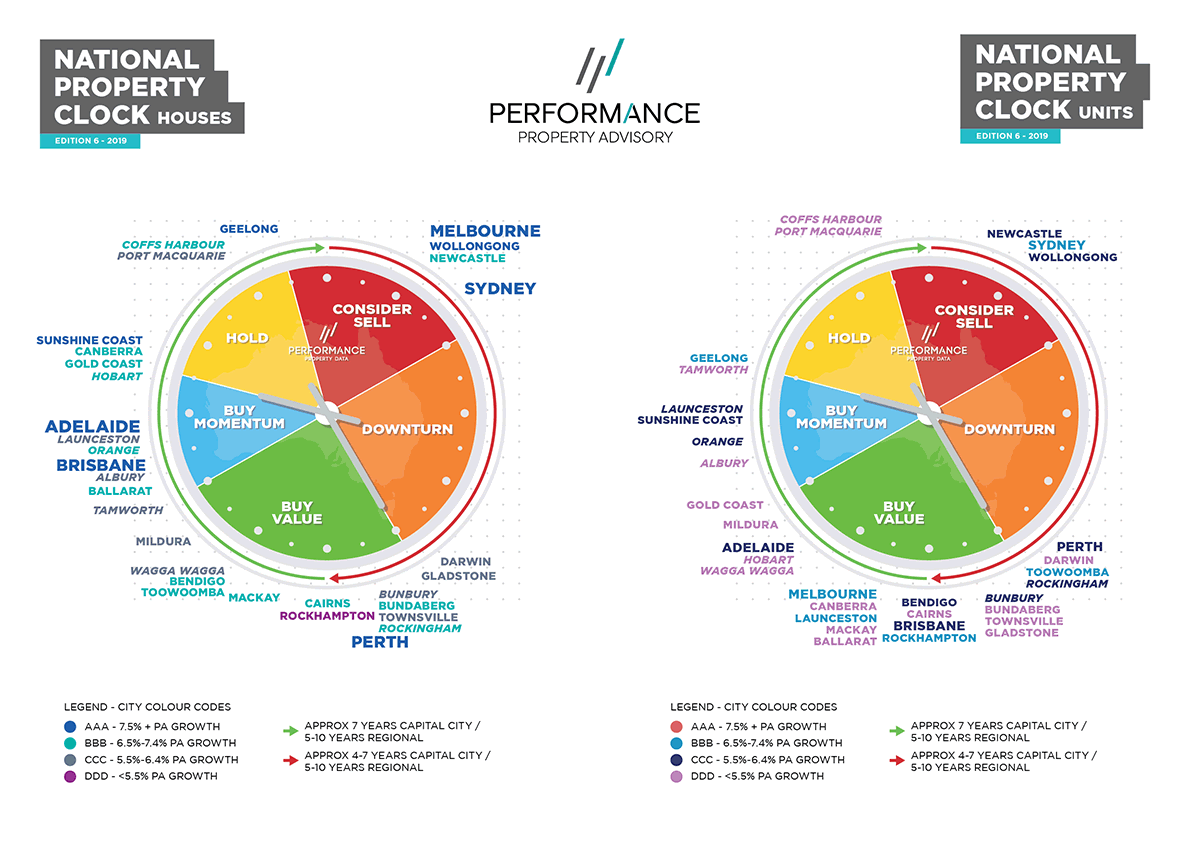
and our research department has produced new reports for each of these cities. The links can be found below. Our research allows us to form a view of each market and plot where we believe both the house and unit markets sit on the PPA property clock.
The Key Indicators that are studied are:
- The Economy
- Affordability
- Supply
- Demand
- Investment Value
The Economy section is broken down into Money Supply and Confidence in the major capital city reports.
Links to each report, and our property clock are below. As always, if you have any questions in regards to these, or any region in Australia please contact me.
Sunshine Coast Overview
Similar to most markets across the country, the Sunshine Coast house median fell approximately -2% in the March quarter in response to the uncertainty created with the election, the Royal Commission and lending restrictions. This slight fall in price has helped with affordability, with 30% of the average gross wage needed to pay the average sized mortgage (assuming 20% deposit) and we still believe there is growth left in this market before peaking. The clear positive for this market is the clear upward trend population growth. 2017 to 2018 saw the population grow 2.8%, well above the national rate of 1.55%. That equates to almost 8000 new people calling the Sunshine Coast home.
Click here to download our Sunshine Coast Research Report
Gold Coast Overview
The Gold Coast is another Queensland example of strong population growth, 2.6% in 2018 and 12,335 extra people calling the Gold Coast home. After the Commonwealth Games in 2018 though we’ve seen job creation and infrastructure spending fall and the unemployment rate rise. However, this market has been underperforming it’s long term growth rate and we do expect to see some upward price movement in the short term.
Click here to download our Gold Coast Research Report
Orange Overview
The Orange house median house price has increased 23% since the end of the last stagnation period in 2016. This has resulted in the price to income ratio hitting an historic high of 5.1 (median house price is 5.1 times the average wage) and is a measure of how easy (or hard) it is to save a deposit. The population growth rate rise from 0.28% in 2017 to 1.34% in 2018, although 77% of this increase was as a result of natural increase (births minus deaths) rather than migration. Check out the full report to see if there are enough fundamentals present to support growth in the short term future.
Click here to download our Orange Research Report
Albury Overview
In Albury houses are as affordable as they were in 2009 and the price to income ratio is 4.2, the same as it was in 2007. House prices have moved 21% over the last 5 years. Positives for growth potential in this market centre around a falling unemployment rate and rising job vacancies, falling approval numbers and a tightening vacancy rate and falling stock levels and increasing sales volumes. This market should continue to tick along.
Click here to download our Albury Research Report
If you have any questions in relation to these research reports or any other region in Australia, please feel free to contact me at any time.


Leave A Comment